CFM experimental outlook: a Bayesian update
A short synthesis on improving Conditional Funding Markets (CFMs) and testing them rigorously.
TL;DR. Make CFMs work at scale by (1) running a transparent experiment program with explicit hypotheses and baselines, (2) focusing on decisions where CFMs can plausibly deliver 10× gains over the status quo, and (3) running many trials on consistent metrics to reach statistical significance. Healthy markets are hard: satisfy LPs/traders, projects, and funders by choosing use‑cases that can sustain liquidity and participation.
1) Where we stand
A concise view of goals and constraints before new data arrives.
- Two objectives: maximize metric‑ROI and ensure capture‑resistance. We’ll measure the former while insisting on the latter.
- Institution over gadget: avoid “pay‑to‑win.” We want conditional prices that inform funding and build an institution whose accuracy compounds via self‑reinforcing market participants.
2) What we’ve learned
Posterior updates from recent runs and reviews.
Many of these takeaways come from preparing and running Uniswap Foundation Growth CFM #1:
- Pluralism beats single shots: repeated CFMs on comparable KPIs enable statistically meaningful learning.
- Fit: CFMs shine where information is decentralized, outcomes are uncertain, and horizons are longer.
- Metrics & liquidity: Attributable metrics are capital‑efficient; consider non‑attributable ones only when they can tap adjacent liquidity (e.g., token price markets).
- Metric alignment is hard: funders must define metrics that are simple, robust, comparable; and genuinely aligned to higher goals.
- Normalization is non‑trivial: confounders (asset prices, collateral mix) burden traders, even if cross‑project counterfactual spreads help the decision.
- Manipulation is real: the best defense is stronger markets (more independent traders/makers); non‑attributable metrics can reduce gaming but cost depth; out‑of‑mechanism penalties deter sabotage.
- Single‑winner is brittle: it discourages small projects and induces cliffs.
- Framework over inner mechanics: without hypotheses + baseline, evaluation devolves to mechanism minutiae.
- Window design matters: volatility caps, light randomization; extend decision time (≤ ~48h) if
volatility × spreadis too high.
3) What to measure next
Data we can gather before/alongside the next cohorts.
- Ex‑ante alignment: short applicant rubric mapping KPI gains to the funder’s macro objective.
- Baseline definition: for every cohort, specify a matched baseline (e.g., conventional grants) and a measurement window.
- Manipulation economics (simple): estimate cost to move the metric near decision time and private value of the grant.
- Normalization checks: keep a compact set (e.g., Inflows, Relative Share, Fees); pick USD vs ETH or a simple composite.
4) How to run the experiments
Structure that maximizes information gain per dollar.
Use Sections 1-2 as the hypotheses we’re testing.
Design levers
- Multi‑winner / split allocations (gradient): replace cliffs with marginal-ROI‑based splits. (Separate write‑up forthcoming.)
- Onboard independent traders/makers: maker programs, APIs, research bounties → more counter‑manipulative flow and depth.
- Observation window safeguards: volatility caps, light randomization; option to delay decision (≤ ~48h) when
volatility × spreadis high. - Auxiliary markets (optional): link/mirror resolution only when the metric naturally matches an existing market; otherwise, skip.
- ETH/USD composite: blend or cross‑check when confounding is material.
- Out‑of‑mechanism safeguards: light review council, public incident notes, reputational penalties, and optional bonding (slashable financial bond on proven manipulation/sabotage).
Protocol
- Metric & capture alignment: secure funder sign‑off on success metrics and what counts as captured vs non‑captured CFMs.
- Power targeting: plan the number of CFMs per KPI to reach desired statistical power (e.g., 80%) for a plausible effect size/variance; small grants are fine if N↑.
- Paired pilots: run CFM and matched baseline each cohort; document differences.
- Instrumentation: track depth, reversals, spread↔TWAP gap, directional vs counter‑flow, and ex‑post alignment scores.
- Transparency: release anonymized datasets + short learning notes.
Outcomes to evaluate
- Capture‑resistance: define and assess criteria; until there’s a standard, do ad‑hoc evaluations and publish reasoning.
- Effectiveness vs baseline: realized ROI and error bars by KPI and horizon.
- Decision robustness: reversals, threshold stability, realized vs forecast deltas.
- Manipulation & sabotage: incidents, responses, and any bonding actions.
5) Principles for success
Simple rules that keep the program honest and useful.
- Extend experiments. Prefer many small CFMs on consistent KPIs or a single CFM with many candidate projects to maximize statistical relevance.
- Aim where 10× is plausible. Pick contests where market aggregation can beat baselines by a wide margin.
- Always include a baseline. Make comparisons explicit.
- Design for participation. Favor multi‑winner rules and legible rubrics to keep smaller teams in the game.
- Keep metrics legible. Prefer simple, robust KPIs; use auxiliary markets only when they naturally fit.
- Measure.
6) Next steps
Butter will be looking to collaborate with researchers on guiding this program, conducting co‑design experiments, and publishing peer‑reviewed work. Independent replication and external critique will give the program the credibility it needs for CFMs to succeed long‑term.
Appendix
Experiment loop
A compact view of how the program iterates from priors to better decisions.

Objectives breakdown
How we think about the breakdown in objectives.
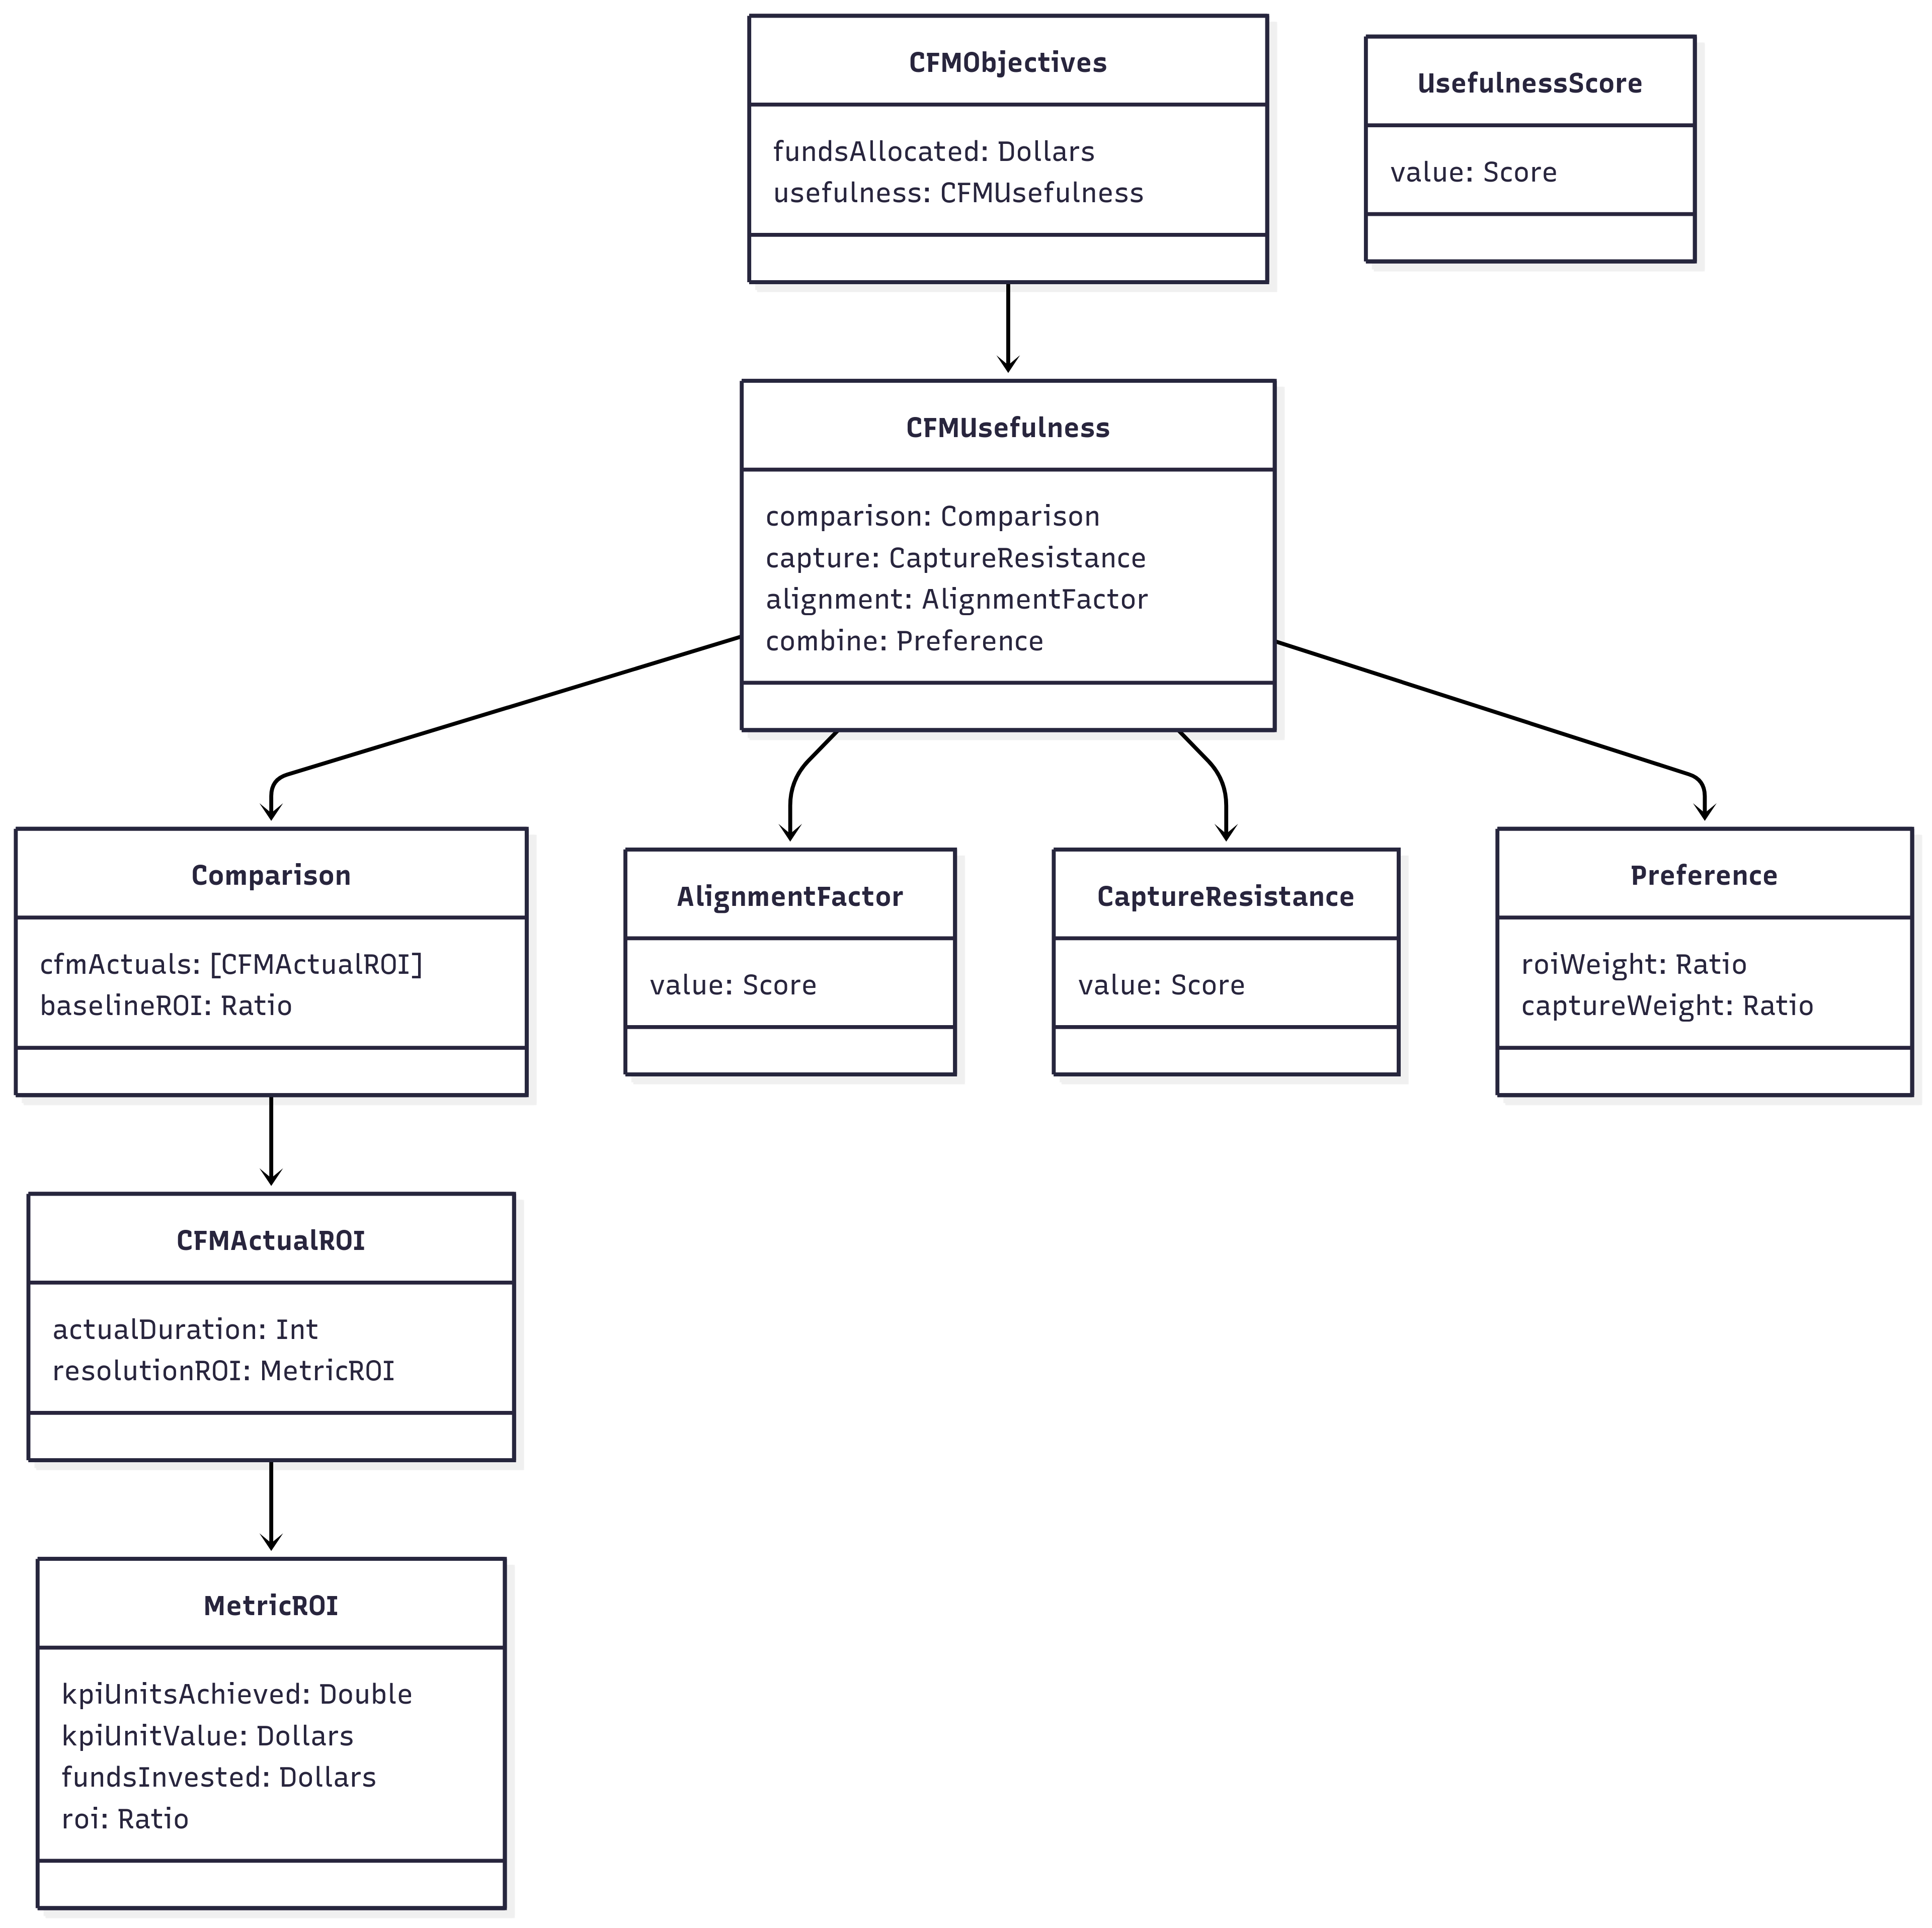
CFMObjectivesrecords two things:fundsAllocatedandusefulness.CFMUsefulnessis built byComparison+CaptureResistance, adjusted by anAlignmentFactorinside ROI, then combined viaPreferenceinto a singleUsefulnessScore.- In
Comparison, we gather manyCFMActualROI(one per CFM run). Each points to aMetricROIwhereroi = (kpiUnitsAchieved × kpiUnitValue) / fundsInvested, then multiply byAlignmentFactor.value. - We duration‑weight across runs to get an aggregate CFM ROI, and compare it to a
baselineROIper cohort (ratio or delta; be consistent). Preference = { roiWeight, captureWeight }withroiWeight + captureWeight = 1; alignment is folded into ROI (not a separate weight).CaptureResistance.valueis defined ex‑ante and evaluated ex‑post.- Output:
UsefulnessScorefor the program;fundsAllocatedis recorded separately for accountability.